Challenges
Stats Under the Stars 9 - Forecasting delle segnalazioni sulla rete stradale
Termina il 21.06.2026The challenge focuses on forecasting operational cases across the ANAS national road network.
ANAS manages thousands of requests, reports, and operational cases generated by road users, maintenance activities, infrastructure conditions, and external events. Understanding how these cases evolve over time is essential for planning resources, improving operational efficiency, and supporting decision-making processes.
Participants will work on a real-world dataset containing historical records collected between 2016 and 2025 and will be expected to apply data analysis, feature engineering, and forecasting techniques to predict future demand patterns.
Participants are expected to develop a solution that addresses the following problem:
Data and Problem: A dataset containing historical records of requests, reports, and operational cases across the ANAS road network is provided. The data are available at the event level and are not aggregate.
Goal: Develop a forecasting model capable of predicting the number of operational cases for each road and each month in the test period.
Additional resources, including accident-related data and public information on road closures and traffic restrictions (https://www.stradeanas.it/it/comunicati-stampa), are provided and may be used to enrich the predictive models. Participants are also allowed to integrate publicly available external data sources, such as weather data and other relevant information.

Phone Users 25
Termina il 05.04.2026A telecommunications company is interested in analysing the behaviour of each customer regarding its telephone traffic. For a set of customers, they want to forecast traffic for the coming month (number of total seconds of outgoing calls made in the month) using the data available to date (the previous 9 months).
medical_abstract
Termina il 31.03.2026L’anamnesi è un testo che descrive le condizioni pregresse e attuali di un paziente. I medici ospedalieri analizzano regolarmente decine o centinaia di anamnesi ogni giorno mentre visitano i pazienti e spesso devono rapidamente cogliere le informazioni salienti che indicano la malattia del paziente.
Il dataset medical_abstract.csv contiene 11.550 (9.550 usati come training e 2000 come validazione) di questi testi in lingua inglese, ognuno già codificato rispetto a 5 macro condizioni cliniche:
1 | neoplasie;
2 | malattie del sistema digerente;
3 | malattie del sistema nervoso;
4 | malattie cardiovascolari;
5 | condizioni patologiche generali.
Si costruisca un modello predittivo per classificare la classe di problemi descritti nell’abstract e se ne testino le capacità previsive.

Rice Varieties 25
Termina il 10.01.2026A total of 2810 rice grain’s images were taken for the two species (Cammeo=1 and Osmancik=2), processed and feature inferences were made. Seven morphological features were obtained for each grain of rice.
Original Article: https://ijisae.org/index.php/IJISAE/article/view/1068/599
Dataset Description: https://archive.ics.uci.edu/dataset/545/rice+cammeo+and+osmancik
DATASET: https://www.muratkoklu.com/datasets/
Data Set Name: Rice Dataset (Commeo and Osmancik) Abstract: A total of 3810 rice grain’s images were taken for the two species (Cammeo and Osmancik), processed and feature inferences were made. 7 morphological features were obtained for each grain of rice.
Source: Ilkay CINAR Graduate School of Natural and Applied Sciences, Selcuk University, Konya, TURKEY ilkay_cinar@hotmail.com
Murat KOKLU Faculty of Technology, Selcuk University, Konya, TURKEY. mkoklu@selcuk.edu.tr
DATASET: https://www.muratkoklu.com/datasets/
Relevant Information: In order to classify the rice varieties (Cammeo and Osmancik) used, preliminary processing was applied to the pictures obtained with computer vision system and a total of 3810 rice grains were obtained. Furthermore, 7 morphological features have been inferred for each grain. A data set has been created for the properties obtained.
Attribute Information: 1. Area: Returns the number of pixels within the boundaries of the rice grain. 2. Perimeter: Calculates the circumference by calculating the distance between pixels around the boundaries of the rice grain. 3. Major Axis Length: The longest line that can be drawn on the rice grain, i.e. the main axis distance, gives. 4. Minor Axis Length: The shortest line that can be drawn on the rice grain, i.e. the small axis distance, gives. 5. Eccentricity: It measures how round the ellipse, which has the same moments as the rice grain, is. 6. Convex Area: Returns the pixel count of the smallest convex shell of the region formed by the rice grain. 7. Extent: Returns the ratio of the region formed by the rice grain to the bounding box pixels 8. Class: Commeo and Osmancik.
Relevant Papers / Citation Requests / Acknowledgements: Cinar, I. and Koklu, M. (2019). Classification of Rice Varieties Using Artificial Intelligence Methods. International Journal of Intelligent Systems and Applications in Engineering, vol.7, no.3 (Sep. 2019), pp.188-194. https://doi.org/10.18201/ijisae.2019355381.

Wine Quality
Termina il 07.10.2025The inputs include objective tests (e.g. PH values) and the output is based on sensory data (median of at least 3 evaluations made by wine experts). Each expert graded the wine quality between 0 (very bad) and 10 (very excellent).
P. Cortez, A. Cerdeira, F. Almeida, T. Matos and J. Reis (2009) Modeling wine preferences by data mining from physicochemical properties. In Decision Support Systems, Elsevier, 47(4):547-553. ISSN: 0167-9236
Stats Under the Stars 8
Termina il 16.06.2025The challenge is centered around money laundering, which is the llegal process of obtaining money from criminal activities and making it appear to be earned legally.
This is typically achieved by passing the illicit funds through legitimate financial institutions and channels to disguise their true origin.
The AML (Anti-Money Laundering) is a central issue in modern banking and finance, as institutions must comply with strict regulations and develop
systems to detect and prevent these illicit activities.
Participants will work on a realistic dataset simulating transactional banking data and will be expected to apply machine learning and analytical techniques to identify suspicious patterns.
Participants are expected to develop a solution that addresses the following problem:
Problem: A dataset containing transaction information from a bank is provided. Among thousands of legitimate transactions, a small proportion is suspected to be related to money laundering activities.
Goal:Implement a binary classification model capable of distinguishing between regular and laundering transactions
Bibliography
The following references provide foundational works and key studies
related to AML, financial fraud detection, and machine learning techniques
applied to transaction analysis.
• N. E., Ahmad. Anti-money Laundering
using Graph Techniques. Doctoral Thesis, University of Porto, 2024.
• B. Dumitrescu, A. Băltoiu, S. Budulan. Anomaly
Detection in Graphs of Bank Transactions for Anti Money Laundering
Applications. IEEE Access, 2021.
• R. Karim, F. Hermsen, Felix, S.A. Chala, P. De Perthuis,
A. Mandal.Scalable Semi-Supervised Graph Learning Techniques for Anti Money
Laundering. Proceedings of the International Conference on Machine Learning (ICML),
2022.

Business Game 2025
Termina il 10.04.2025The Business Game 2025: Driving the Future of Car Insurance!
Insurance companies are increasingly adopting Usage-Based Insurance (UBI) technologies to personalize premiums based on driving behavior. The integration of telematics data allows for improved risk estimation, reducing both losses (through better pricing) and operational costs (by identifying low-risk customers).
The objective of this challenge is to develop a Machine Learning model capable of accurately estimating the expected economic damage for an auto insurance portfolio. This model will leverage both traditional variables (e.g., driver’s age, vehicle type, claims history) and telematics data (e.g., driving style, mileage, harsh braking incidents, usage times).
Join us in revolutionizing the auto insurance industry through data-driven insights and cutting-edge technology!
Stats Under the Stars 7
Termina il 09.04.2025Adecco, as an employment agency, has among its main missions the one of making the future work for everyone, meaning also to find a job for all people looking for it. This task might seem simple, but there are many variables to consider: skills and experience required by the job (in a scenario of talent mismatch), location of the workers, formal requirements (like patents)..
As an additional challenge, Adecco has more than 2.5 Milions people in its database and works yearly with more than 25k companies: if the number of possibilities for workers is extremely big, on the other side finding the best job for every person is an extremely hard task.
As for the majority of the use cases, technology can help here.
The challenge we are presenting aims to find a way to understand how much a given candidate is fitting a given job.

Sales prediction
Termina il 09.04.2025This competition is a copy of the Challenge of the Business Game 2024.
-———————————————————————————————————————————
Welcome to the Business Game 2024! In this challenge, participants are invited to leverage their data science skills and predictive modeling techniques to forecast the sales quantity of fashion shops accurately. This competition presents an exciting opportunity to tackle real-world business problems faced by retailers in the fashion industry.
The goal of this challenge is to develop robust predictive models that can effectively anticipate the quantity of sales for fashion shops over a specified time period. Participants will be provided with a dataset containing historical sales data, including factors such as time of sale, type of clothing items sold, and other relevant variables. Utilizing this dataset, participants are tasked with building predictive models that can accurately forecast future sales quantities, enabling fashion shop owners and managers to make informed decisions regarding inventory management, marketing strategies, and resource allocation.
This challenge offers a unique chance for participants to demonstrate their proficiency in data analysis, feature engineering, and machine learning algorithms. Successful solutions will not only rely on technical expertise but also on the ability to understand the nuances of the fashion retail industry and translate data insights into actionable recommendations.
Whether you’re an experienced data scientist looking to showcase your skills or a newcomer eager to delve into the world of predictive modeling, this challenge provides an excellent platform to test your abilities, learn from peers, and contribute to advancing the field of retail analytics.
Join us in this exciting journey to unlock valuable insights into fashion shop sales forecasting and pave the way for more informed decision-making in the dynamic world of retail. Good luck!

Business Game 2023
Termina il 09.04.2025Malware Detection
The rapid growth of app development in the smartphone market has made it an easy and accessible target for Malware.
A Malware is any software intentionally designed to cause disruption to a computer, server, client, or computer network, leak private information, gain unauthorized access to information or systems, deprive access to information, or which unknowingly interferes with the user’s computer security and privacy.
When Malware infects an operating system (OS), it tries to avoid detection by antivirus programs and gain control over the OS by changing Permissions.
Permissions are the authorizations that an app requests from the user to access device features, such as the camera, SMS, location, contacts, and so on.
The increasing number of native OS Permissions and developers’ ability to create custom Permissions provide plenty of options to gain control over devices and private data.
Therefore, Permissions could be of great importance in detecting a Malware. Analyzing Permissions can help identify suspicious apps that may pose a risk to device security.
The challenge is to create an efficient system that curbs the threat of Malware using machine learning techniques to classify benign and malicious Apps.

Business Game 2022
Termina il 09.04.2025Business game organizzato dall’Università di Padova in collaborazione con BeeViva: Twitter Engagement
Twitter ha oltre 400 milioni di users, è la principale piattaforma di micro-blogging, di diffusione di notizie ed è anche usata per azioni di marketing massive, ma mirate.
L’Engagement è il grado di coinvolgimento dello user in risposta al tweet misuarato come numero di retweet, favorite ed altre reazioni. La capacità di creare post che coinvolgano e ‘attivino’ il lettore è una skill fondamentale per ogni azienda che voglia essere incisiva nel proprio settore.
La sfida di questa competizione chiede di prevedere l’Engagement generato da un tweet sulla base delle sue caratteristiche, del testo contenuto e dello user che lo ha pubblicato.
Business game organized by the University of Padova in collaboration with BeeViva: Twitter Engagement
Twitter has got over 400 million users, is the main micro-blogging and news dissemination platform and is also used for massive but targeted marketing actions.
Engagement is defined as the degree of user involvement in response to the tweet measured as the number of retweets, favorites and other reactions.
The ability to create posts that engage and ‘activate’ the reader is a fundamental skill for any company that wants to be incisive in its sector.
The challenge of this competition is to predict the Engagement generated by a tweet on the basis of its characteristics, the text and the user who posted it.
Business Game 2024
Termina il 11.04.2024Welcome to the Business Game 2024! In this challenge, participants are invited to leverage their data science skills and predictive modeling techniques to forecast the sales quantity of fashion shops accurately. This competition presents an exciting opportunity to tackle real-world business problems faced by retailers in the fashion industry.
The goal of this challenge is to develop robust predictive models that can effectively anticipate the quantity of sales for fashion shops over a specified time period. Participants will be provided with a dataset containing historical sales data, including factors such as time of sale, type of clothing items sold, and other relevant variables. Utilizing this dataset, participants are tasked with building predictive models that can accurately forecast future sales quantities, enabling fashion shop owners and managers to make informed decisions regarding inventory management, marketing strategies, and resource allocation.
This challenge offers a unique chance for participants to demonstrate their proficiency in data analysis, feature engineering, and machine learning algorithms. Successful solutions will not only rely on technical expertise but also on the ability to understand the nuances of the fashion retail industry and translate data insights into actionable recommendations.
Whether you’re an experienced data scientist looking to showcase your skills or a newcomer eager to delve into the world of predictive modeling, this challenge provides an excellent platform to test your abilities, learn from peers, and contribute to advancing the field of retail analytics.
Join us in this exciting journey to unlock valuable insights into fashion shop sales forecasting and pave the way for more informed decision-making in the dynamic world of retail. Good luck!

Business Game 2021
Termina il 11.04.2024Business game organizzato dall’Università di Padova in collaborazione con BeeViva
In ambito finanziario, l’innovazione più disruptive degli ultimi anni è senza dubbio quella delle criptovalute.
BeeViva ti sfida a risolvere un problema legato ad un sistema automatizzato di trading in questo contesto.
La Sfida
Una società fintech intende sviluppare un sistema di trading automatico che opera nel mercato delle criptovalute.
Il primo step è stato quello di individuare dei segnali, regole che identificano delle opportunità di trading.
Quando intravede un opportunità il sistema invia un ordine di acquisto (BUY) ed è già predisposto per chiudere l’eventuale trade con un ordine di vendita (SELL).
Rimane da stabilire l’entità del trade (SIZE), quanto vogliamo scommettere, e proprio in questo consiste la nostra sfida.
La società ha raccolto un insieme di indicatori di contesto osservati in concomitanza del segnale che identifica una potenziale opportunità di trading.
Ti chiede quindi di sviluppare un sistema in modo da poter investire complessivamente 1000$ nelle opportunità che si verificheranno in futuro.
Gli indicatori raccolti sono eterogenei. Ci sono indicatori relativi all’analisi tecnica (RSI, MACD, …) e altri più specifici di natura statistica (standard deviation, test di stazionarietà delle serie storiche, stime dei parametri di equazioni differenziali…). Complessivamente sono più di cento (vedi la sezione Dataset per i dettagli).
Oltre a questi, il dataset che ti hanno fornito contiene:
- un ID Trade
- un ID Segnale (ci sono due tipi di segnali diversi)
- un ID Crypto, che identifica la specifica cryptocurrency per la quale si è verificato il segnale
- il ritorno del trade (ROI), così misurato: (prezzo@SELL/prezzo@BUY)-1.
Inizi l’analisi dei dati… e ti accorgi che se avessi scommesso la stessa quantità in tutti i segnali avresti perso. Ma che c*** di segnali ti hanno fornito?
Tuttavia hai già firmato un contratto. Come uscirai da questa situazione imbarazzante?
Obiettivo della competizione
Allocare 1000$ ai segnali di trading per massimizzare il profitto (ROI)
in poche parole:
Devi produrre un vettore di pesi Wi, a somma 1000, della stessa dimensione del testset.
Se il vettore non somma 1000, verrà normalizzato a somma 1000 dal sistema e in base a questi pesi verranno stabilite le performance della tua previsione.
Non sono consentiti pesi negativi. Sono ammessi pesi pari a zero.
Disclaimer
Questa sfida nasce con l’intento di valutare le vostre capacità nel risolvere problemi di business attraverso la data science.
Non è certamente un invito a fare trading nel mercato delle cryptovalute che per sua natura è molto volatile e quindi molto rischioso. Noi lo sconsigliamo.
___________________________________________________________
Business game organized by the University of Padua in collaboration with BeeViva
In the financial field, the most disruptive innovation of recent years is undoubtedly cryptocurrencies.
BeeViva challenges you to solve a problem related to an automated trading system in this context.
The Challenge
A fintech company intends to develop an automated trading system that operates in the cryptocurrency market.
The first step was to identify signals, rules that identify trading opportunities.
When it sees an opportunity, the system sends a purchase order (BUY) and is already set up to close any trade with a sell order (SELL).
It remains to establish the size of the trade (SIZE), how much we want to bet, and this is precisely our challenge.
The company has collected a set of context indicators observed in conjunction with the signal that identifies a potential trading opportunity.
He then asks you to develop a system so that he can invest a total of 1000$ in opportunities that will arise in the future.
The indicators collected are heterogeneous. There are indicators related to both technical analysis (RSI, MACD, …) and more specific ones of a statistical nature (standard deviation, stationarity test of time series, estimates of parameters of differential equations …). Altogether they are more than a hundred (see the Section Dataset for details).
In addition to these, the dataset they provided you with contains:
- a Trade ID
- a Signal ID (there are two types of different signals)
- a Crypto ID, which identifies the specific cryptocurrency for which the signal occurred
- the return of the trade (ROI), measured as: (price@SELL/price@BUY)-1.
You start analyzing the data … and you realize that if you had bet the same amount on all signals you would have lost. What the f*** signals did they give you?
However, you have already signed a contract. How will you get out of this awkward situation?
Challenge Goal
Allocate 1000$ to trading opportunity signals to maximize profit (ROI)
in a nutshell:
You must produce a vector of weights W i, to sum 1000, of the same size as the testset.
If the vector does not sum 1000, it will be normalized to sum 1000 by the system and based on these weights the performance of your forecast will be established.
Negative weights are not allowed. Zero weights are allowed.
Disclaimer
This challenge was born with the intent of evaluating your abilities in solving business problems through data science.
It is certainly not an invitation to trade in the cryptocurrency market which by its nature is very volatile and therefore very risky. We advise against it.
Business Game 2020
Termina il 11.04.2024Business game organizzato dall’Università di Padova in collaborazione con Bee Viva.
Bee Viva vi propone un problema di Reverse Engineering applicato alla predizione di risultati nei match di un gioco online.
Obiettivo della competizione: prevedere il numero di eventi contropiede generati (Eventrs_CA)
Informazioni sul funzionamento:
In ogni partita la squadra avversaria può vedersi assegnata fino a 10 occasioni da goal in base alla sua capacità di possesso palla (Possession0, MaxPossession0, MinPossession0).
Quando la squadra avversaria ha un occasione da goal e la sbaglia (DefenseAvg1, MaxMaxDefenseAvg1, MinMinDefenseAvg1) può verificarsi un contropiede. La probabilità che si verifichi un contropiede dipende dalla sua abilità (TacticSkill) e dal livello della partita (MHStats).
Business game organized by the University of Padua in collaboration with Bee Viva.
Bee Viva proposes you a Reverse Engineering problem applied to the prediction of results in the matches of an online game.
Competition Goal: predict the number of counterattack events generated (Eventrs_CA)
How it works:
In each game the opposing team can be assigned up to 10 scoring chances based on their ability to hold the ball (Possession0, MaxPossession0, MinPossession0).
When the opposing team has a scoring opportunity and misses it (DefenseAvg1, MaxMaxDefenseAvg1, MinMinDefenseAvg1) a counterattack can occur. The probability of a counter attack occurring depends on its skill (TacticSkill) and the level of the match (MHStats).
Stats Under the Stars 6 - Trading tulips
Termina il 21.06.2023In this competition, you will take on the role of a 1600 dutch tulip trader managing his portfolio of 12 rare flowers:
1 Admirael de Man (AM)
| 2 Admirael Laotur (AL)
| 3 Anvers (A)
| 4 Generael Otto (GO)
|
5 Jan Symonsz (JS)
| 6 Kamelot van Weena (KvW)
| 7 Kleine Alexander (KA)
| 8 Semper Augustus (SA)
|
9 Switser (S)
| 10 Verwindt (Ve)
| 11 Viseroij (Vi)
| 12 Zomerschoon (Z)
|


But unlike bulb merchants in the Dutch Golden Age you will have computers, market data, and modern statistics at your disposal.
You will have access to hourly data on the spot and forward markets of bulbs in the period from 1634 to 1637. For each tulip you will receive the following 26 features:
1. Open
2. Close
3. High
4. Low
5. Volume 1h
6. Number of trades 1h
7. Return 5m
8. Return 15m
9. Return 30m
10. Return 45m
11. Return 1h
12. Realized variance 1h
13. Realized skewness 1h
14. Realized kurtosis 1h
15. Parkinson variance 1h
16. Garman-Klass variance 1h
17. Rogers-Satchell variance 1h
18. Long short ratio 5m
19. Long short ratio 15m
20. Long short ratio 30m
21. Long short ratio 45m
22. Long short ratio 1h
23. Forward premium open
24. Forward premium close
25. Forward premium high
26. Forward premium low
with prices expressed in Gulden and logarithmic returns.
Using all the tools in your modern data scientist’s box, you are tasked with creating a trading strategy that for each time t generates the composition wt of a portfolio of tulips.
The portfolio can hold Gulden, and can be both net long and short in each tulip, with a constraint on margin: wtis an array of length 13 normalized in absolute value, i.e.

where the last element of the array is the percentage of the portfolio allocated in cash. But careful, because trading is not free: on each traded Gulden you will pay 0.5 bps in transaction costs.
Will you manage to steadily navigate the risks of a trading bubble? Will you thrive or go bankrupt in the 1600 tulip mania?
Stats Under the Stars 6 - Trading tulips VALIDATION
Termina il 21.06.2023In this competition, you will take on the role of a 1600 dutch tulip trader managing his portfolio of 12 rare flowers:
1 Admirael de Man (AM)
| 2 Admirael Laotur (AL)
| 3 Anvers (A)
| 4 Generael Otto (GO)
|
5 Jan Symonsz (JS)
| 6 Kamelot van Weena (KvW)
| 7 Kleine Alexander (KA)
| 8 Semper Augustus (SA)
|
9 Switser (S)
| 10 Verwindt (Ve)
| 11 Viseroij (Vi)
| 12 Zomerschoon (Z)
|
But unlike bulb merchants in the Dutch Golden Age you will have computers, market data, and modern statistics at your disposal.
You will have access to hourly data on the spot and forward markets of bulbs in the period from 1634 to 1637. For each tulip you will receive the following 26 features:
1. Open
2. Close
3. High
4. Low
5. Volume 1h
6. Number of trades 1h
7. Return 5m
8. Return 15m
9. Return 30m
10. Return 45m
11. Return 1h
12. Realized variance 1h
13. Realized skewness 1h
14. Realized kurtosis 1h
15. Parkinson variance 1h
16. Garman-Klass variance 1h
17. Rogers-Satchell variance 1h
18. Long short ratio 5m
19. Long short ratio 15m
20. Long short ratio 30m
21. Long short ratio 45m
22. Long short ratio 1h
23. Forward premium open
24. Forward premium close
25. Forward premium high
26. Forward premium low
with prices expressed in Gulden and logarithmic returns.
Using all the tools in your modern data scientist’s box, you are tasked with creating a trading strategy that for each time t generates the composition wt of a portfolio of tulips.
The portfolio can hold Gulden, and can be both net long and short in each tulip, with a constraint on margin: wtis an array of length 13 normalized in absolute value, i.e.
where the last element of the array is the percentage of the portfolio allocated in cash. But careful, because trading is not free: on each traded Gulden you will pay 0.5 bps in transaction costs.
Will you manage to steadily navigate the risks of a trading bubble? Will you thrive or go bankrupt in the 1600 tulip mania?
Miss Congeniality
Termina il 12.04.2023The Netflix Prize was a competition to predict user ratings of movies. Netflix provided ratings of 17770 movie titles by 480189 users, along with the date of each rating. The task was to predict ratings for 282000 user-movie-date triples that are not in the training set; all the users and movies in this test set appear in the training set. Netflix judged performance by root mean squared error on the test set and offered a $1,000,000 reward to the first team to improve the performance of their current system by more than 10%. The prize was won in 2009. Details of the Netflix Prize are available at: www.netflixprize.com
Because the Netflix Prize involves a very large data set and a non-standard problem (you could be asked to predict for any movie), the class competition will simplify the problem considerably. The training data provide the ratings of 10,000 users for 99 movies, along with the dates at which the ratings were made. The first 14 of these movies were rated by all users; the remaining 85 may have missing values. The outcome is the rating that each user gave to a further movie (”Miss Congeniality”,2000); you are also given the date that this rating was made.
The task is to predict the rating for this movie by a further 2931 users in the test set. As with the training set, all users in the test set rated the first 14 movies, while the remaining 85 have missing values. The test set provides the same information as the training set – the dates and ratings of these 99 movies along with the date of the rating for ”Miss Congeniality”. As with the Netflix Prize, performance will be measured by root mean squared error (RMSE) on the test set.
Acknowledgments: Giles J. Hooker and Saharon Rosset for providing and sharing the data
HackTheGene
Termina il 18.09.2022HackTheGene è un hackathon per giovani data scientist organizzato dal Dipartimento di Scienze Statistiche dell’Università di Padova in collaborazione con la Società Italiana di Statistica (SIS), la sezione giovani della SIS (youngSIS) e Adecco.
L’obiettivo dell’analisi è quello di fornire uno strumento che sia in grado di prevedere il numero di conteggi di una popolazione di microrganismi, i quali sono identificati tramite le loro unità tassonomiche operazionali (OTU), all’interno di una serie campioni di microbiota prelevati dalla mucosa orale di alcuni pazienti.
Tutte le indicazioni sono fornite sul file “HackTheGene_ITA.pdf” disponibile al seguente link: https://drive.google.com/drive/folders/1B6k_b398zUWnQa3eOZJjy9g40uw4eLc8?usp=sharing
_______________________________________________
HackTheGene is a hackathon competition for young data scientists organized by the Department of Statistical Sciences of the University of Padova, in collaboration with the Italian Statistical Society (SIS), its youth division (youngSIS) and Adecco.
The goal of the analysis is providing a method for predicting the number of counts of a population of microorganisms, identified by their operational taxonomic units (OTU), within a collection of microbiota from the oral mucosa of same patients.
Detailed instructions are given into the file “HackTheGene_ENG.pdf”, available at the following link: https://drive.google.com/drive/folders/1B6k_b398zUWnQa3eOZJjy9g40uw4eLc8?usp=sharing
Orange
Termina il 31.12.2021The dataset is about customers of the French Telecom company Orange.
The goal is to predict the propensity of customers to cancel their account (called churn). For privacy reasons, predictors are anonymized: you don’t know the meaning of any of the predictors.
This dataset is an opportunity to deal with a very large database, including heterogeneous noisy data (numerical and categorical predictors with missing values), and unbalanced class distribution for the response.

Evalita2014 Task3
Termina il 08.06.2020Competizione Evalita 201- Task 3 (Tweets Ironici)
Predizione della ironia di un dataset di documenti di testo
La competizione rimane aperta a scopo didattico
Descrizione e materiale preparatorio
e repository su github:
materiale preparatorio
Evalita2014 Task2
Termina il 08.06.2020Competizione Evalita 2014- Task 2 (Tweets Positivi e Negativi)
Predizione della sentiment di un dataset di documenti di testo
La competizione rimane aperta a scopo didattico
Descrizione e materiale preparatorio
e repository su github:
materiale preparatorio
Evalita2014 Task1
Termina il 08.06.2020Competizione Evalita 2014 – Task 1 (Tweets Soggettivi)
Predizione della soggetività di un dataset di documenti di testo
La competizione rimane aperta a scopo didattico
Descrizione e materiale preparatorio
e repository su github:
materiale preparatorio

Business Game 2016
Termina il 01.05.2020Business game Organizzato assieme all’Università di Padova
Competizione + selezione per colloqui con le aziende
Classifica finale del Business Game (19/04/2916, ore 13.00).
Abbiamo deciso di RIAPRIRE la competizione a solo scopo di approfondimento. Su “Learning” (vedi linguetta a destra) abbiamo attivato un punto di discussione sulla competizione.
_______________________________________________________________________________
Lo scenario proposto è quello di una compagnia che opera nel settore delle telecomunicazioni.
La Direzione intende promuovere una campagna volta a incrementare l’upsell, l’acquisto di prodotti di maggior valore rispetto a quelli inizialmente acquistati dai suoi clienti.
L’estensione della garanzia, l’acquisto di un prodotto di gamma superiore o la sostituzione del prodotto con uno dal margine più alto, sono tutti esempi positivi di upsell.
Nella fase di pianificazione della campagna promozionale viene chiesto al data scientist di identificare il target di clienti verso cui rivolgersi.
Il business problem proposto è tipico di un sistema Customer Relationship Management (CRM). Una strategia per gestire e personalizzare il rapporto con il cliente è quella di produrre degli scores che ne caratterizzano il profilo. Sulla base di questi scores la compagnia può quindi decidere quali siano le iniziative più opportune da intraprendere.

Business Game 2017
Termina il 13.04.2020Business game Organizzato assieme all’Università di Padova
Competizione + selezione per colloqui con le aziende
Classifica finale del Business Game (13/04/2917, ore 13.00).
Abbiamo deciso di RIAPRIRE la competizione a solo scopo di approfondimento. Su “Learning” (vedi linguetta a destra) abbiamo attivato un punto di discussione sulla competizione.
_______________________________________________________________________________
Il perfezionamento dei processi aziendali è sempre stato un tema rilevante per il management.
La sfida che vi proponiamo è quella di stimare il tempo necessario per la chiusura di un intervento di assistenza da parte di un noto gruppo automobilistico.
La Business Unit After Sales gestisce queste richieste attraverso un sistema di ticketing.
Il tempo necessario al loro completamento può richiedere da una giornata fino ad oltre un mese.
Ci sono molti fattori in gioco: la gravità dell’anomalia e le difficoltà dell’intervento, i feedback del
committente (un ticket può essere riaperto perché la soluzione non è ritenta soddisfacente dal cliente), le capacità tecniche e di gestione dell’unità organizzativa preposta, ecc…
Gli interventi possono essere effettuati su scala mondiale. Ragione per cui prevedere tempi e costi permette al management di valutare ed eventualmente riorganizzare l’attività delle unità locali.

Business Game 2018
Termina il 06.04.2020Business game organizzato dall’Università di Padova in collaborazione con Bee Viva.
Proviamo a prevedere il prezzo di una bottiglia di vino sulla base di una collezione di oltre cento mila review di somelier e di altre caratteristiche del prodotto.
Career Service, Università di Padova

Business Game 2019
Termina il 02.04.2020Business game organizzato dall’Università di Padova in collaborazione con Bee Viva.
Il dataset descrive il comportamento di 700 motori a turbina attraverso le rilevazioni di 21 sensori. Ogni motore funziona normalmente all’inizio di ogni ciclo operativo prima di sviluppare un guasto. Il ciclo operativo rappresenta il tempo di funzionamento del motore.
Obiettivo della competizione è prevedere il numero di cicli operativi rimanenti (RUL) prima dello sviluppo del guasto.
Online dating
Termina il 19.11.2019The original OkCupid dataset was created with the use of a python script that pulled the data from public profiles on www.okcupid.com. on 06/30/2012. Permission to use this data was obtained from OkCupid president and co-founder Christian Rudder under the condition that the dataset remains public.
The goal will be to predict whether a person’s profession is in the STEM fields (science, technology, engineering, and math) using a random sample of the overall dataset.
The dataset has 10000 observations divided in n=6000 observations for the training set and m=4000 observations for the test set. It contains p=108 predictors and the response variable (Class, with 2 levels: “other” and “stem”).
Ames house prices
Termina il 04.10.2018The Ames Housing dataset was compiled by Dean De Cock for use in data science.
With 81 predictors describing (almost) every aspect of residential homes in Ames, Iowa, this competition challenges you to predict the final price of each home.
See DeCook “Ames Housing dataset” description in Data Sets.
See Kaggle competition “House Prices: Advanced Regression Techniques”
Clothing store
Termina il 03.10.2018Your task is to predict which customers are most likely to respond to a direct mail marketing promotion (classification problem). Company managers required the model comparisons be made in terms of cost/benefit analysis. A performance score that assesses the effect of the classification model on the business’s profit will therefore be applied. The cost/benefit table for this clothing store marketing promotion example is the following:
True negative (predicted: Nonresponse, actual: Nonresponse) $0 (No contact, no
lost profit)
True positive (predicted: Response, actual: Response) +$26.4 (Estimated profit minus cost of mailing)
False negative (predicted: Nonresponse, actual: Response) -$28.4 (Lost profit)
False positive (predicted: Response, actual: Nonresponse) -$2 (mailing cost)

Stats Under the Stars 4
Termina il 21.06.2018L’azienda Findomestic Banca/S.R.l. (denominata Findomestic), al fine di risolvere un problema di decisione sull’erogazione dei finanziamenti, ha chiesto alla nostra società di organizzare una gara nella quale si sfideranno diversi team. Fate parte del team che, accettando la sfida, è chiamato a proporre un modello statistico che consenta di predire il comportamento dei clienti. Il vostro team risponde che è in grado di costruire un modello statistico molto affidabile, ma all’interno della Findomestic ci sono delle giurie scettiche verso l’approccio statistico per cui verrete sottoposti a una “Proof of Concept”. Al termine della competizione l’azienda deciderà se affidarvi o meno l’incarico.

Bike sharing
Termina il 16.03.2018Bike sharing systems are a means of renting bicycles where the process of obtaining membership, rental, and bike return is automated via a network of kiosk locations throughout a city. Using these systems, people are able rent a bike from a one location and return it to a different place on an as-needed basis. Currently, there are over 500 bike-sharing programs around the world.
The data generated by these systems makes them attractive for researchers because the duration of travel, departure location, arrival location, and time elapsed is explicitly recorded. Bike sharing systems therefore function as a sensor network, which can be used for studying mobility in a city. In this competition, participants are asked to combine historical usage patterns with weather data in order to forecast bike rental demand.

il DataGame di Miriade
Termina il 15.03.2018Vuoi vincere 500 euro e avere la possibilità di svolgere un colloquio in Miriade come Data Analyst? Scopri il DataGame per studenti e laureati organizzato a Padova il 15 marzo da Miriade.
Il lancio della competizione è fissato per l’8 marzo, se non sei ancora iscritto, registrati qui.
 Link alla pagina dell’evento |
Descrizione del problema
I gusti e gli interessi della clientela sono sempre stati un tema rilevante per i grandi distributori.
La sfida proposta è quella di stimare il numero di click registrati (numero di eventi registrati) all’interno dell’e-commerce di un grande rivenditore in relazione alle pubblicità effettuate nei vari canali di comunicazione digitale e alle offerte promozionali lanciate all’interno di essi.
Comprendere al meglio quale intervento pubblicitario riscuote maggiore interesse fra i clienti fa rilevare in maniera più efficiente quali lanci effettuare e su quali prodotti, con conseguente aumento della popolarità del sito e con indirizzamento specifico verso determinati articoli piuttosto che altri.

Stats Under the Stars 3 - RELOAD
Termina il 31.12.2017Questa è la sfida proposta da Findomestic per l’evento SUS3.
Riuscirete a fare meglio dei vincitori di quella bollente notte a Firenze?
Se volete maggiori informazioni sull’evento organizzato dal Dipartimento di Statistica, Informatica, Applicazioni “Giuseppe Parenti” dell’Università degli Studi di Firenze :
• Sito Ufficiale dell’evento,
• Link alla competizione
__________________________________________________________________________
DESCRIZIONE DEL CASE STUDY
Findomestic è una banca che opera nel Credito al Consumo delle famiglie.
La società commercializza i suoi prodotti attraverso un canale lungo ed un canale corto:
Il canale lungo (B2B2C) è rappresentata da tutti i piccoli e grandi partner della Distribuzione Retail
Il canale corto (B2C) è rappresentato dalle 200 agenzie sparse su tutto il territorio italiano.
Attraverso il canale lungo, la Findomestic colloca i suoi prodotti di Credito Classico finalizzati all’acquisto di un prodotto di consumo (elettronica ed arredamento in particolare).
Attraverso il canale corto colloca invece i suoi prodotti di Prestito Personale.
Case history
Nel mese di gennaio la società decide di testare la proposta del proprio Prestito Personale attraverso il canale telefonico outbound.
Considerato che il costo di ogni telefonata è di 2,50€, ed avendo stabilito un budget mensile per le attività di Direct di 100.000 €, la proposta può essere fatta solamente a 40.000 nominativi.
La Direzione Marketing decide di estrarre casualmente i clienti a cui fare la proposta telefonica (40.000 su 200.000).
Il mese successivo vengono osservati i risultati delle vendite ottenute attraverso la proposta telefonica e la Direzione chiede, al proprio ufficio CRM, di elaborare un algoritmo di scoring per poter ripetere l’operazione non in modo aleatorio ma bensì mirato ad ottimizzare l’investimento.
L’ufficio di Analytics utilizza dunque i 40.000 clienti oggetto del test (rappresentativi dell’intero portafoglio clienti) per creare un modello di correlazione con la variabile target “accetta la proposta di finanziamento”.
Per modellizzare tale fenomeno, l’ufficio ha a disposizione diverse variabili che caratterizzano ogni cliente e che possono essere ricondotte a 3 macro categorie:
- variabili sociodemografiche
- variabili di equipaggiamento
- variabili storico-comportamentali
Il CRM finalizza uno Score predittivo e viene dunque deciso di fare una nuova campagna outbound.
Per questo, vengono stanziati 25.000 € per questa nuova attività.
Viene dunque chiesto al CRM di selezionare 10.000 clienti, tra i 160.000 clienti che non sono stati chiamati la volta precedente, in modo da ottimizzare l’investimento.
I prodotti del canale lungo sono pubblicizzata e proposti direttamente negli Store, mentre i prodotti del canale corto (Prestito Personale) vengono proposti con un’accurata attività di Direct Marketing, prevalentemente mailing ed email.
Ogni mese la società scrive a tutti i clienti del proprio portafoglio, costituito da 200.000 nominativi, per offrirgli i propri prodotti.
Considerato un costo per singolo mailing di 0,50€, la società ha dunque stanziato un budget mensile di 100.000€ per la propria attività di Direct.

Internet advertisements
Termina il 30.11.2017This dataset represents a set of possible advertisements on Internet pages. The features encode the geometry of the image (if available) as well as phrases occuring in the URL, the image’s URL and alt text, the anchor text, and words occuring near the anchor text. The task is to predict whether an image is an advertisement (“ad”) or not (“nonad”).
(See also ad.DOCUMENTATION file)
1. original data: http://archive.ics.uci.edu/ml/datasets/Internet+Advertisements
2. Sources:
(a) Creator & donor: Nicholas Kushmerick <nick@ucd.ie>
© Generated: April-July 1998
3. Past Usage:
N. Kushmerick (1999). “Learning to remove Internet advertisements”,
3rd Int Conf Autonomous Agents. Available at
www.cs.ucd.ie/staff/nick/research/download/kushmerick-aa99.ps.gz.
Accuracy >97% using C4.5rules in predicting whether an image is an
advertisement.
4. This dataset represents a set of possible advertisements on
Internet pages. The features encode the geometry of the image (if
available) as well as phrases occuring in the URL, the image’s URL and
alt text, the anchor text, and words occuring near the anchor text.
The task is to predict whether an image is an advertisement (“ad”) or
not (“nonad”).</nick@ucd.ie>
Connessioni telefoniche
Termina il 30.11.2017Nell’attività di segmentazione e profilazione della clientela, la
direzione marketing di una società di telecomunicazioni cellulari è
interessata ad analizzare alcuni dati che ha a disposizione con lo scopo
di conoscere meglio le caratteristiche dei suoi clienti. La società
oltre al normale servizio telefonico fornisce una serie di prodotti
aggiuntivi di cui i clienti in possesso di cellulari UMTS possono
usufruire a pagamento.
La direzione marketing è interessata ad acquisire una conoscenza sulle
caratteristiche dei clienti che utilizzano il servizio di “navigazione”
su internet da telefonino. A puro titolo di esemplificazione, un aspetto
di questa conoscenza può riguardare un’indicazione circa il fatto che
navigano di più coloro che anche telefonano di più o se invece la
navigazione su internet “sostituisce” in qualche modo la telefonata.
Oppure può essere utile vedere se chi naviga molto utilizza anche altri
servizi specifici dei telefono UMTS forniti dalla società di telefonia,
quali le videochiamate o i videomessaggi.
La società è anche interessata a prevedere per ciascun cliente quali
caratteristiche lo portano ad utilizzare più comunemente questo servizio.
I dati disponibili riguardano solo il comportamento del cliente rispetto
agli altri prodotti e servizi offerti dall’azienda, mentre per vari
motivi (legge sulla “privacy”, database non sincroni, etc.) non sono
disponibili informazioni di carattere socio-demografico.
Specificamente, si chiede di prevedere il numero di connessioni effettuate in un mese fissato.
Traffic Prediction in Telecommunications
Termina il 30.11.2017Una azienda di telecomunicazioni è interessata ad analizzare il comportamento di ciascun cliente relativo al suo traffico telefonico.
Per un insieme di clienti, si vuole prevedere il traffico per il prossimo mese (numero di secondi totali di chiamate in uscita effettuati nel mese) utilizzando i dati a disposizione fino ad oggi (i 9 mesi precedenti).

TWsentiment
Termina il 30.11.2017Trova un buon modello per prevedere la sentiment in questo dataset di tweets

Wine quality
Termina il 02.10.2017The goal is to predict whether a wine is ’good’ or not based on predictors such as residual sugar, alcohol content, acidity and other characteristics of the wine.

Stats Under the Stars 2
Termina il 10.09.2017Stats under the stars 2
__________________________________________________________________________________
Questa è la competizione organizzata per l’evento Stats Under the Stars 2 svoltosi nella notte tra 7 e 8 giugno 2016 nell’ambito del 48esimo Convegno Nazionale della Società Italiana di Statistica, Vietri sul Mare (Salerno)
__________________________________________________________________________________
La commissione giudicatrice composta da Raffaele Miele (Crisma s.r.l) , Bruno Scarpa (Università di Padova), Giuseppe Giordano (Università di Salerno) e Cosimo D. Vitale (Università di Salerno) ha valutato gli elaborati delle squadre che hanno partecipato all’evento Stats under the stars 2 in base a criteri quantitativi che qualitativi. Premesso che i premi assegnati non possono essere cumulativi, le squadre vincitrici risultano
le seguenti:
• PathFinders
Migliore progetto che unisce ottima previsione oggettiva e miglior valutazione dei giudici. Premio: 1000 euro (offerto da CRISMA s.r.l.)
• Campioni Casuali
Migliore previsione oggettiva. Premio: un corso SAS gratuito a scelta per ciascun componente della squadra vincitrice (offerto da SAS)
• Celtic Team
Migliore report che si distingue per la qualità della stesura e della presentazione dei risultati. Premio: un voucher di ₤ 150 sterline (squadra di 2 componenti) o di ₤ 260 (squadra con più di 2 componenti) per l’acquisto di prodotti sul sito online CRC Press (offerto da Taylor & Francis)
• I Mistura
Migliore report che combina e valorizza i dati esterni nell’analisi. Premio: consultazione per 5 mesi del database Orbis di Bureau van Dijk che raccoglie i dati economico finanziari dettagliati e confrontabili delle società, banche ed assicurazioni di tutto il mondo (offerto da Bureau van Dijk)
Descrizione della competizione svolta
__________________________________________________________________________________
Stop fraud before it happens!
Carte di credito, Bancomat o contanti. Nessuno strumento di pagamento è al
sicuro da truffe e furti, né nel mondo virtuale né in quello reale. Ma grazie a
piccole accortezze e ai sistemi di sicurezza il numero delle frodi nell’uso della
moneta elettonica sono diminuite…
Descrizione Challenge e Dataset Stats Under the Stars 2 (formato pdf)
Analizzerete un dataset così come fornito dall’azienda italiana CRISMA Srl.
Il vostro obiettivo è quello di scoprire le operazioni fraudolente in relazione
alle caratteristiche delle transazioni, in modo da prevedere le prime
in funzione delle seconde.
Regolamento Competizione Stats Under the Stars 2 formato pdf)
Stats Under the Stars 3
Termina il 28.06.2017Risultati della competizione
Le squadre vincitrici della sfida Stats under the Stars 3 (e report presentati) sono:
• Call of data (Università di PD) Migliore progetto che unisce ottima previsione oggettiva e miglior valutazione dei giudici. Premio: 1.000€ offerti da Findomestic.
• Just can’t fit enough (Università la Sapienza, Roma) Migliore previsione oggettiva. Premio: corso gratuito offerto da SAS.
• Rosti ma robusti (Università di PD) Migliore report che si distingue per la qualità della stesura e della presentazione dei risultati. Premio: libri offerti da Pearson.
• Sample Minds (atenei vari) Migliore comunicazione, ovvero il report con la migliore capacità di rendere fruibili i risultati anche ad un pubblico di non addetti ai lavori. Premio: un tablet offerto da Aruba.
Sito Ufficiale della competizione
Findomestic è una banca che opera nel Credito al Consumo delle famiglie.
La società commercializza i suoi prodotti attraverso un canale lungo ed un canale corto:
Il canale lungo (B2B2C) è rappresentata da tutti i piccoli e grandi partner della Distribuzione Retail
Il canale corto (B2C) è rappresentato dalle 200 agenzie sparse su tutto il territorio italiano.
Attraverso il canale lungo, la Findomestic colloca i suoi prodotti di Credito Classico finalizzati all’acquisto di un prodotto di consumo (elettronica ed arredamento in particolare).
Attraverso il canale corto colloca invece i suoi prodotti di Prestito Personale.
Case history
Nel mese di gennaio la società decide di testare la proposta del proprio Prestito Personale attraverso il canale telefonico outbound.
Considerato che il costo di ogni telefonata è di 2,50€, ed avendo stabilito un budget mensile per le attività di Direct di 100.000 €, la proposta può essere fatta solamente a 40.000 nominativi.
La Direzione Marketing decide di estrarre casualmente i clienti a cui fare la proposta telefonica (40.000 su 200.000).
Il mese successivo vengono osservati i risultati delle vendite ottenute attraverso la proposta telefonica e la Direzione chiede, al proprio ufficio CRM, di elaborare un algoritmo di scoring per poter ripetere l’operazione non in modo aleatorio ma bensì mirato ad ottimizzare l’investimento.
L’ufficio di Analytics utilizza dunque i 40.000 clienti oggetto del test (rappresentativi dell’intero portafoglio clienti) per creare un modello di correlazione con la variabile target “accetta la proposta di finanziamento”.
Per modellizzare tale fenomeno, l’ufficio ha a disposizione diverse variabili che caratterizzano ogni cliente e che possono essere ricondotte a 3 macro categorie:
- variabili sociodemografiche
- variabili di equipaggiamento
- variabili storico-comportamentali
Il CRM finalizza uno Score predittivo e viene dunque deciso di fare una nuova campagna outbound.
Per questo, vengono stanziati 25.000 € per questa nuova attività.
Viene dunque chiesto al CRM di selezionare 10.000 clienti, tra i 160.000 clienti che non sono stati chiamati la volta precedente, in modo da ottimizzare l’investimento.
I prodotti del canale lungo sono pubblicizzata e proposti direttamente negli Store, mentre i prodotti del canale corto (Prestito Personale) vengono proposti con un’accurata attività di Direct Marketing, prevalentemente mailing ed email.
Ogni mese la società scrive a tutti i clienti del proprio portafoglio, costituito da 200.000 nominativi, per offrirgli i propri prodotti.
Considerato un costo per singolo mailing di 0,50€, la società ha dunque stanziato un budget mensile di 100.000€ per la propria attività di Direct.
Stats Under the Stars
Termina il 12.12.2015Wine not?
Valutazione della qualità sensoriale dei Vini
(dataset concesso da www.valoritalia.it)
Questa è la competizione organizzata per l’evento Stats Under the Stars svoltosi nella notte tra 8 e 9 settembre 2015 a Padova – Caffè Pedrocchi, Sala Rossini.
__________________________________________________________________________________
VALORITALIA è una società leader in Italia nelle attività di controllo e certificazione della qualità di vini DO e IG e sui vini da tavola con indicazione del vitigno e/o dell’annata. Controlla più del 70% del vino italiano a denominazione ed è dislocata sul territorio nazionale con 35 sedi. Nello specifico ogni riga del vostro dataset corrisponde ad un vino per il quale tre macro categorie di variabili, descritte qui di seguito, sono disponibili.
In particolare ogni riga del vostro dataset corrisponde ad una valutazione effettuata da VALORITALIA su un certo prodotto vinicolo per il quale tre macro categorie di informazioni, descritte qui di seguito, sono disponibili.
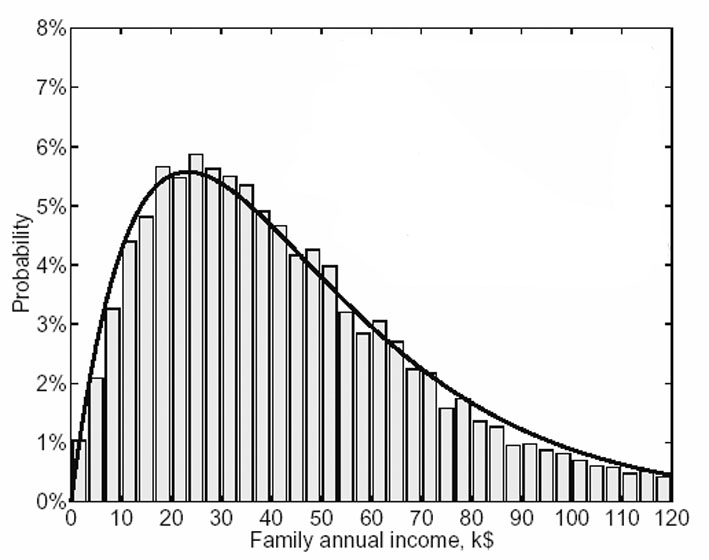
Explaining Income Inequality
Termina il 11.01.2015Competizione organizzata da D.Solari, M. De Nadai e L. Finos
trainingSet: 6071 observations
testSet 2000 observations
Bee-thon
Termina il 28.05.2014Benvenuto al primo bee-thon!
Il contest si svolge il 30 maggio 2014 dalle ore 15.00 presso il talent-lab in Via Monselice, 15 a Padova.
La chiusura del contest è prevista per le ore 19.00
maggiori informazioni su: Bee-thon